CED Systems · Dashboards for brokers & team leads
Your closings come from somewhere specific. Here are 7 reasons you probably can't prove where.
Ask a team lead where last quarter's closings originated and you'll hear a story. The dashboards replace the story with a ledger: sources, listings, sphere, and pipeline — eleven views that cross-filter into one picture of the business.
See a built view, live — Where Closings Come From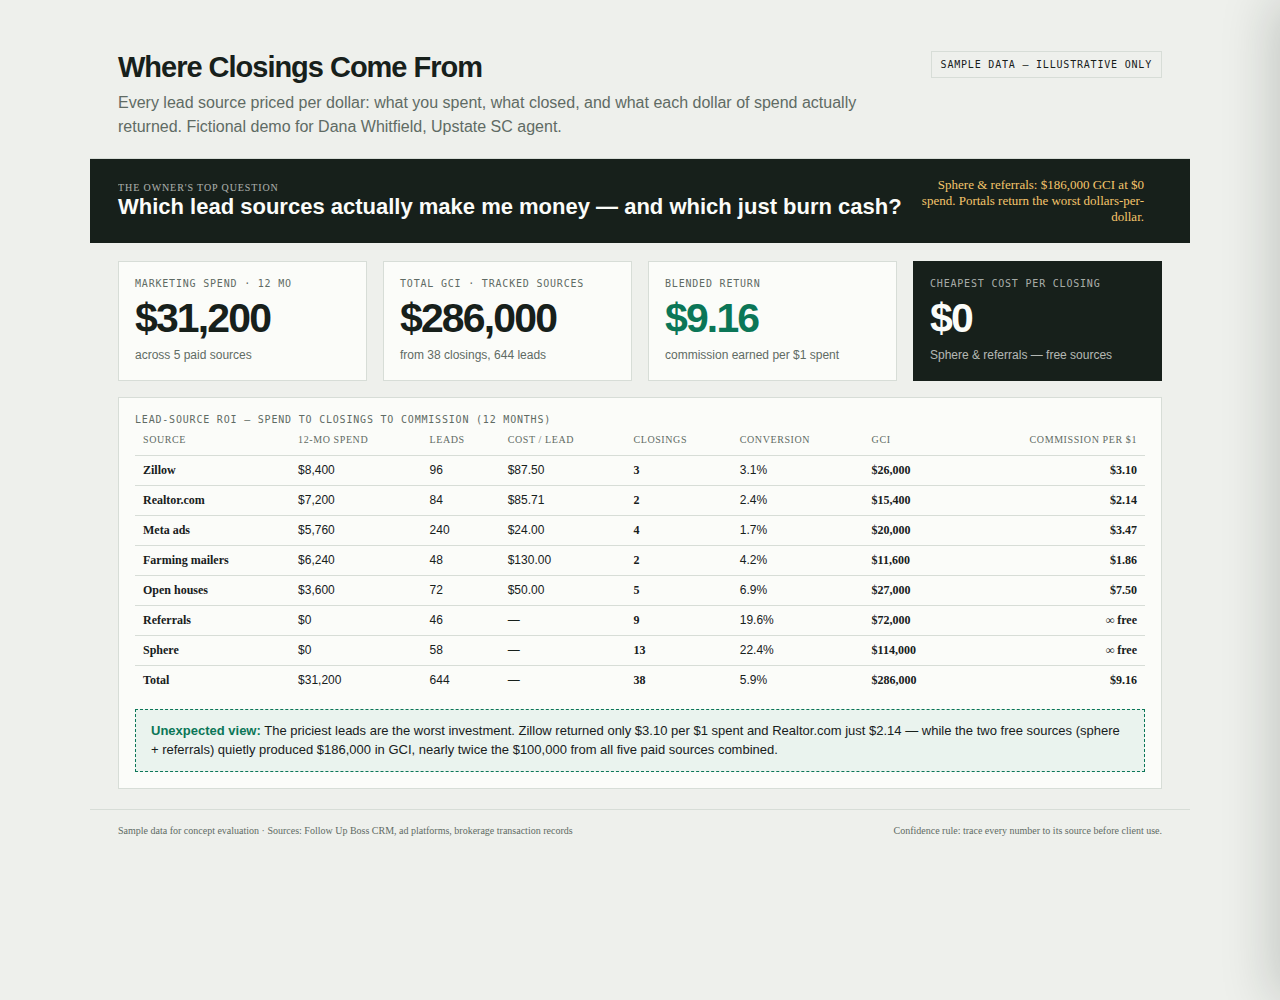
One of the built views, working: Where Closings Come From — shown with sample data, labeled as sample data. The demo is the real build, not a mockup.
Call (864) 999-4430 — see my real estate dashboard Email for a walkthroughSee it with sample data first, in a short walkthrough. Then we talk about connecting yours.
The real estate collection
- Where Closings Come From — every closing traced to its true source — the argument-ender for marketing spend
- Listing Health Monitor — listings scored on trajectory: showing pace, price position, days — act before the expiry does
- Expiry Hunter — expired and expiring listings worked systematically, yours first
- Sphere Harvester — your past clients and sphere, ranked by likelihood and timing — the cheapest closings you'll ever get
- Pipeline Leak Map — stage by stage, where deals and leads quietly fall out
- Neighborhood Profit Index — where your business is actually profitable, farm by farm
- And 5 more on the shelf — Absorption Pulse, Listing P&L, Buyer Closing Radar, Unmet Demand Finder, Fee Analyzer. Each answers its own money question, and every one cross-filters with the rest.
Every view answers one money question. Stack views together and they cross-filter — click one number and the rest of the board answers for that slice of your business.
7 reasons to run your team on a board instead of reports
Reason 1 · Source truth
Stories about lead sources cost real money
Where Closings Come From traces every closed deal to its origin — sphere, sign call, portal, past client — so budget follows the ledger instead of whoever argued loudest at the sales meeting.
Reason 2 · Listings have trajectories
A listing's fate is visible weeks early
Showing pace, price position against the segment, and days-on-market form a health score. The Listing Health Monitor flags the saves while they're saveable — price conversation at day 20, not regret at expiry.
Reason 3 · The sphere is a mine
Past clients close cheap — if you work the timing
The Sphere Harvester ranks your database by likelihood and life-event timing, turning 'stay in touch' from a slogan into a weekly call list ordered by expected value.
Reason 4 · Not a generic report
Built for your trade, not adapted to it
Generic BI tools show you charts of whatever you feed them. These views were designed around the decisions brokers and team leads actually make — the money questions are baked in, not configured later by you.
Reason 5 · Reconciles or it doesn't ship
Every number ties back to your source
A dashboard you can't trust is worse than none. Each headline figure reconciles to the underlying records, and you can drill from the headline down to the individual deal behind it.
Reason 6 · Already built
You see the real thing, not a mockup
This collection exists — built, working, walkthrough-ready with sample data, clearly labeled as sample data. You're not funding a prototype; you're connecting a finished instrument to your business.
Reason 7 · A weekly rhythm
One board, one short weekly meeting
The board is built for a weekly rhythm: what made money, what leaked, what gets decided this week — the same questions, answered from the same reconciled numbers, every Monday.
How it works
- See it first. Walk through the built dashboard with sample data — the exact views, working — before you commit to anything.
- Connect your data. We connect the dashboard to the systems you already run and map your fields to the views. Every headline number reconciles back to your source.
- Run on it weekly. A Monday-morning board: what made money, what leaked, what needs a decision. We support the dashboard and its functions — your data entry and accuracy stay yours, as they should.
The objections we hear
“Our CRM does pipelines.”
It tracks individuals. These eleven views score the system — sources, listings, neighborhoods, sphere yield, per-listing P&L — cross-filtered, so the broker sees patterns no contact record shows.
“Eleven dashboards is a lot.”
You don't start with eleven. The walkthrough shows the shelf; most teams start with closings-source, listing health, and the sphere — and stack more views in as they want them. Stacked views cross-filter each other.
“What does it cost?”
Set on the call, after you've seen the views work. Call (864) 999-4430 or email dashboards@cedservice.com.